
The Bank operates a call center that contacts customers for information updates in various banking applications. Representatives use the internal XYZ Tool to edit and update applications. The tool tracks updates, success rates, and representative activity. Supervisors manually export data from XYZ Tool and create report for senior leadership. The dashboard project aims to provide better insights, streamline reporting, and ensure uniform success metrics across teams.
PROJECT BRIEF
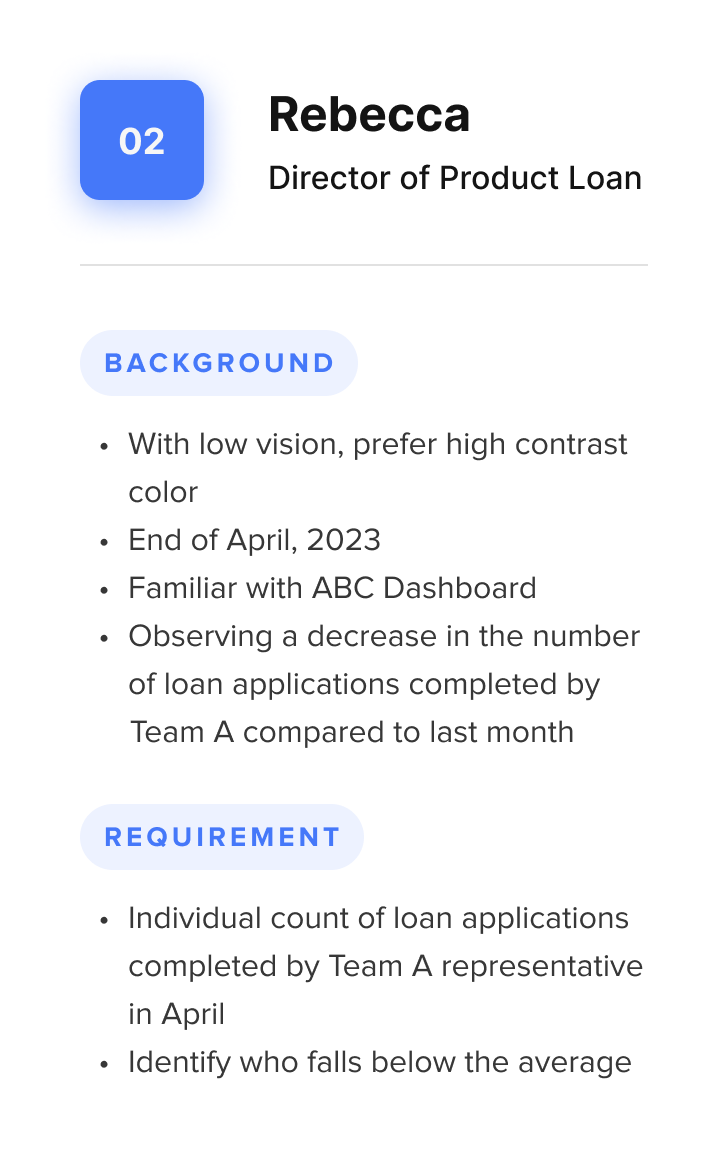
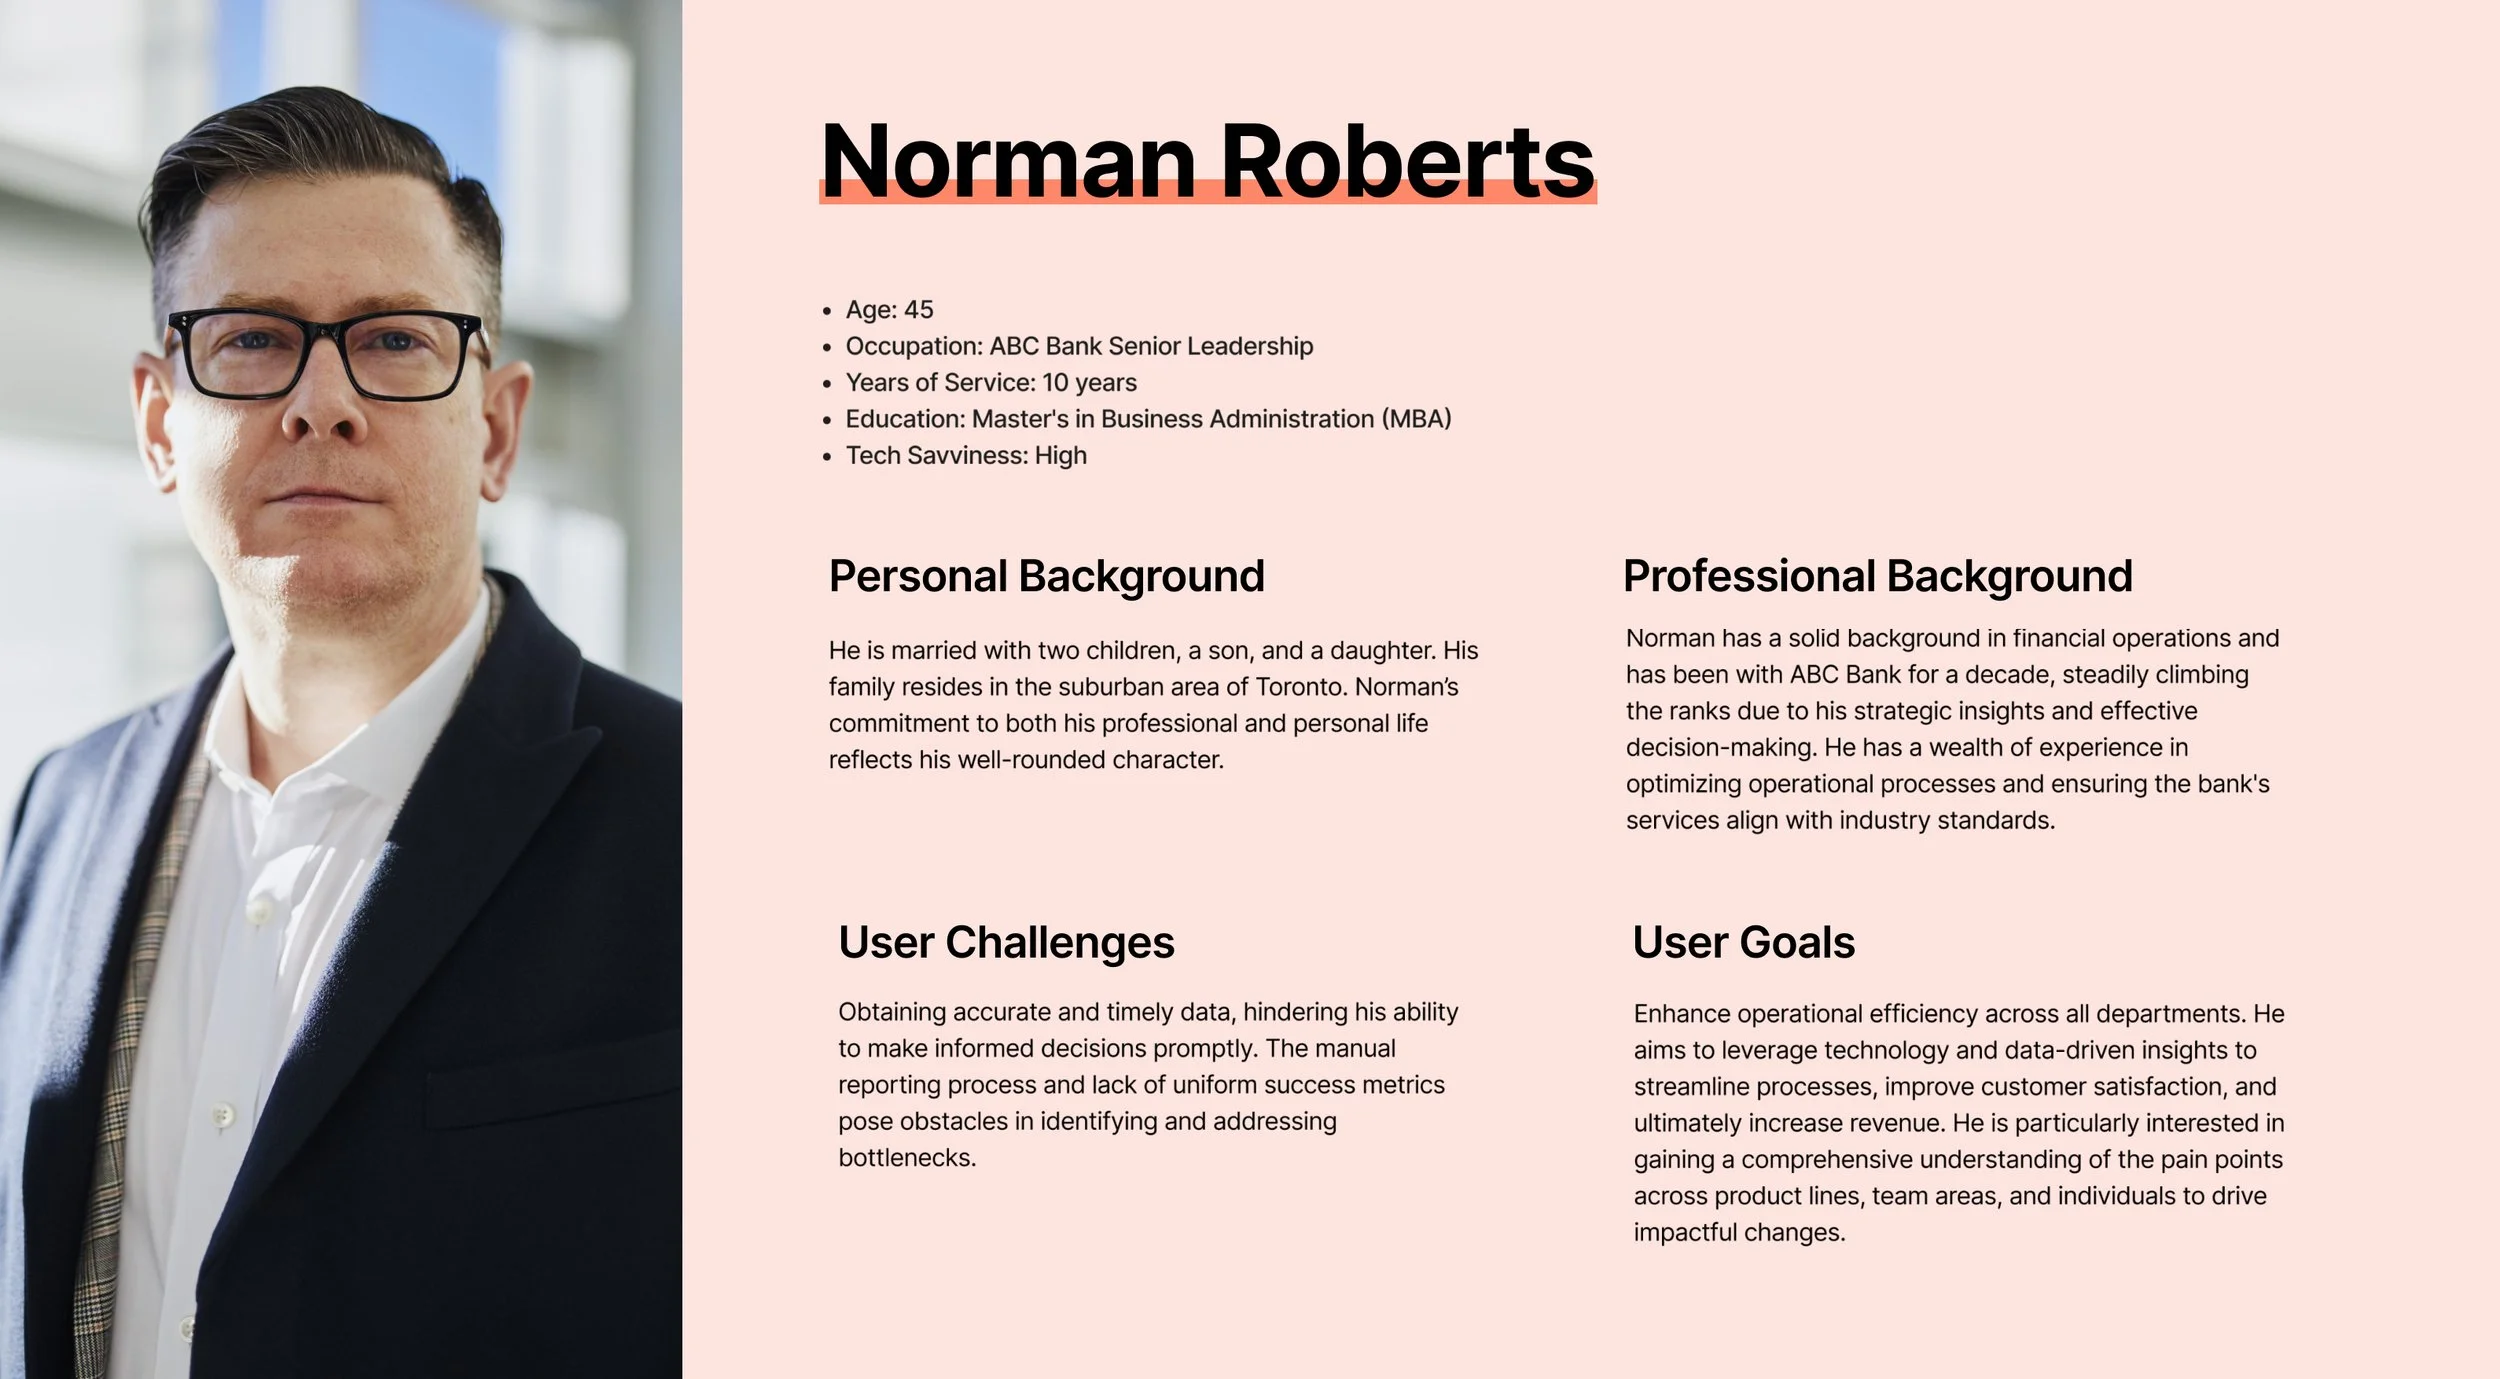
USERS
Bank Supervisors
Ideation, Research, User Testing, Visual Design, User Experience, Prototyping
ROLE
2023
YEAR
Problem Statement
Management team faces challenges in obtaining timely and accurate insights into product lines, team areas, and individual performance, blocking decision-making and effective assistant.
The Solution
Prototypes based on specific scenario


Phase 01
Understand & Research
Organization Structure
Current Workflow
User Research


Phase 02
User’s Needs & Problems

Pain Points
Problem Statement
Management team faces challenges in obtaining timely and accurate insights into product lines, team areas, and individual performance, blocking decision-making and effective assistant.
Project Requirement

Phase 03
Idea Creation
MVP Version
Deliver core features to provide basic functionalities and meet the user’s requirements.
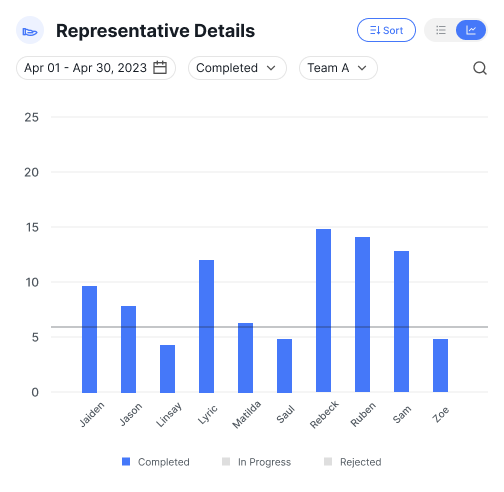
Analytics - key metrics, graphs & charts
Applications - source data of all applications, graphs & charts
Employees - basic info, workload, time distribution
User-specific Dashboards - create multiple dashboards tailored to specific needs or projects, switch between different dashboard seamlessly
Workspace - report management, shared with me/saved dashboard
Themes - switch between dark & light mode (accessibility)
Notifications
Settings
Training and support - tutorials, tips
Further Iterations
Based on the feedback that will gather from post-launch usability test, more features and functionalities can be added.
Widget Library - Create a library of widgets or components representing various data visualizations (charts, graphs, tables). Enable users to add, remove, and customize these widgets on their dashboard.
Highly customizable dashboard - allows users to arrange and resize widgets or modules based on their preferences
Mobile version/ Mobile App
Might integrate XYZ tool to the ABC dashboard
Performance optimization - Optimize the dashboard's performance to ensure smooth loading and responsiveness, especially when dealing with a large volume of data
Phase 04
Design Solutions
Restructure Workflow

Wireframe

Design System

Mockup


Phase 05
Usability Test & Design Iteration
Passionate, collaborative, and always up for a challenge.
If you're looking for a talented Senior Product Designer who can elevate your product and deliver exceptional user experiences, I am ready to embark on the journey with you. My Resume
